Smart Energy Meter
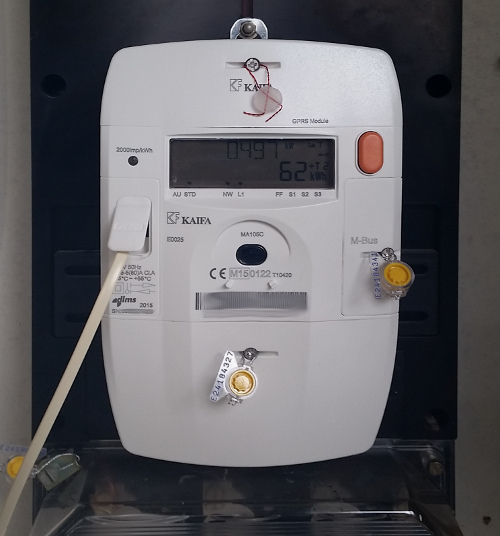
Last week our energy supplier installed a new, so called, "Smart Meter" in our house. In fact we've got two of those. One of them is the gas meter, which reports its counter every hour to the new electricity meter. Six times a year the counters are sent to the energy company, who will eventually send us their bill.
Lots of people refuse this smart meter because they fear of loosing their privacy.
Who cares, they are going to find out what my consumption is anyway.
We're all going to get a smart meter eventually.
Now they install it for free, but chances are that you're going to pay for it in the end if you keep refusing.
Either by higher energy prices or by paying for the meter sooner or later.
So I decided to play along.
Perhaps this smart meter has some benefits for me too.
I don't know to what extent the information on this page is relevant for my international visitors. Perhaps other countries have similar energy meters. I can't imagine that these meters are solely created for the Dutch market.
Not So Smart Energy Meter
Before the smart meters I used to take pictures of both electricity meter and gass meter every week. Later I would enter the counters into a spread sheet to monitor our own energy consumption. Surely this is going to be lot easier with the smart meter, right?
WRONG!
These smart meters aren't that smart as they claim to be.
It appears that the meter has 4 counters, instead of just one.
One of the counters registers my energy consumption during day time tariff, while a second counter counts the consumption during the night/weekend tariff.
The remaining two counters do the same for energy I might feed back to the grid.
However I don't have any solar panels yet.
And I don't have a dual tariff contract either.
With a dual tariff contract you pay more for your power consumption during the day time, and less during the night/weekend time.
So instead of having only one counter to read, I have to read 2 (or 4 if I had solar panels).
Then I would have to add those counters together in order to see how much energy I have consumed over the past week.
I don't consider that to be very smart, why can't the meter do that for me.
On top of that the display of the smart meter has a very poor contrast ratio, which makes it extremely difficult to read in the dark.
OK, my camera can use its flash light to improve on that, but only one of the counters is visible at any given time.
So I have to press the menu button several times, take several pictures, and hope that I've got them all right because I can't read the counters in the dark myself.
Later I have noticed another flaw in the "Smartness" of the Smart Energy Meter.
Let's pretend that my Smart Meter says that my solar panels deliver 2 kW back into the grid.
At that moment I don't receive any power from the grid, so the delivery counter shows 0 kW.
How am I supposed to know how much power I'm consuming at that moment?
In other words: How much power do my Solar Panels generate at that moment?
The only way of knowing that is to hope for a small cloud to cover the sun for a few minutes, to keep my solar panels from obfuscating my consumption.
The P1-Port To The Rescue
Fortunately all energy meters in the Netherlands have a mandatory P1-Port, which is basically a serial output which reports all counters every 10 seconds. By feeding this serial data into a Raspberry Pi I can make my Smart Meter accessible from all over the world (for my eyes only of course). This allows me to draw much more accurate graphs of my energy consumption, without having to take half a dozen pictures every week.
Obviously there are several different types of Smart Meters around.
All appear to have quite a lot in common, both in hardware and in protocol.
One major difference is the baud rate though.
Some older meters use a 9600 baud rate, with 7 data bits, Even parity and 1 stop bit.
Most modern meters use a more common baud rate of 115200, 8 data bits, no parity and 1 stop bit.
It's easy enough to find out which baud rate your meter uses.
If one doesn't work, simply try the other one.
This won't break anything.
There's even an official document, describing the P1-Port in detail. It can be downloaded through this link.
Electrical Connection
Fortunately all types of meters have the same physical connection. There must be an RJ-11 connector somewhere on your meter. It may be behind a lid or rubber flap, but it should be easily accessible. You do not have to break any seals to get to the P1-port. Breaking seals B.T.W. is illegal and can be very dangerous!
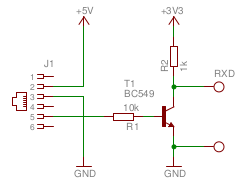
Only 3 wires of the 6-pin RJ-11 connector are of interest to us.
The others are either not connected internally, or may have different functions on different meters.
Pin 2 is the RTS (Request To Send) signal.
In the meter this is simply the LED of an Opto-Coupler, with a series resistor.
All you need to do is to apply 5V between this pin and GND (pin 3), this instructs the meter to send a datagram every 10 seconds, as long as the 5V is applied.
Pin 3 is the ground pin for both the RTS input and the RxD output.
Pin 5 is the RxD output.
Well, actually it is the TxD output, which has to be connected to the RxD input of a computer or processor.
This output is in fact the photo transistor of an other Opto-Coupler inside the Smart Meter.
The collector of this transistor does have an internal pull-up resistor to the 5V, which is applied to pin 2.
There's just one thing wrong with this serial output, its signal is inverted.
So you'll need a small inverter circuit to drive your computer or micro controller.
If need be, this inverter may of course also be used as a level shifter for 3.3V logic circuits.
Below is an example of such an inverter circuit.
The pull up resistor R2 can either be connected to the +5V or the +3.3V supply voltage, depending on the requirements of your computer/controller.
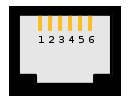 RJ-11 socket
Front view
An Extra Job For Dave
At first I thought I would add another Raspberry Pi in the meter cupboard, just for the purpose of monitoring the Smart Meter.
In my case this would have been a bit of an overkill, as Dave, another Raspberry Pi I'm running, is just about 8 meters away from the meter cupboard.
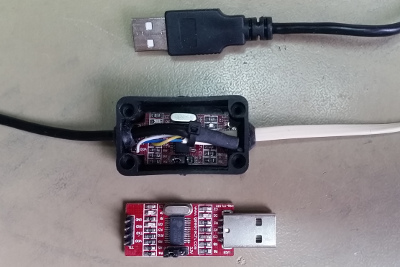
So I decided to create a small USB to serial converter, with a long wire attached to it, which would directly connect to the Smart Meter.
I could have used the internal serial port of the Raspberry Pi.
But that one is already in use on Dave.
And above all, having a USB connection means that I did not have to open Dave up again.
So it's up to you whether you want to connect the Smart Meter directly to the Raspberry Pi, or use a cheap USB to serial converter, just like I did. The result is the same.
I've used a cheap USB to serial converter which I've bought from Deal Extreme.
It contains a PL-2303 USB to serial converter, and all the necessary peripheral components.
I also had a neat small box lying around, which would be perfect for this small PCB.
Only a few small modifications were required to make it fit.
The USB connector itself had to go, and the four corners of the PCB had to be filed down.
This broke the Vcc output track though, which came from the center pin of the voltage selector.
Fixing this was easily done with a small piece of wire.
Finally the output header of the PCB had to go, otherwise the wires could not enter the box.
The header was replaced by the inverter circuit, which is sown above.
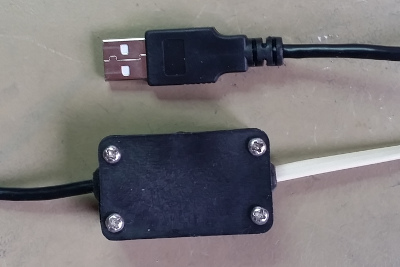
In my case the pull-up resistor of the inverter was fed by the 5V supply. If you want to connect the output of the inverter directly to the RxD pin of your Raspberry Pi you should connect the pull-up resistor to 3.3V instead!
The Datagram
This is what a typical datagram from the Smart Meter looks like:
/KFM5KAIFA-METER

1-3:0.2.8(42)
0-0:1.0.0(160304215822W)
0-0:96.1.1(4530303235301234303567893232312345)
1-0:1.8.1(000072.833*kWh)
1-0:1.8.2(000062.071*kWh)
1-0:2.8.1(000000.000*kWh)
1-0:2.8.2(000000.000*kWh)
0-0:96.14.0(0001)
1-0:1.7.0(01.069*kW)
1-0:2.7.0(00.000*kW)
0-0:96.7.21(00008)
0-0:96.7.9(00005)
1-0:99.97.0(1)(0-0:96.7.19)(000101000001W)(2147483647*s)
1-0:32.32.0(00000)
1-0:32.36.0(00000)
0-0:96.13.1()
0-0:96.13.0()
1-0:31.7.0(005*A)
1-0:21.7.0(01.087*kW)
1-0:22.7.0(00.000*kW)
0-1:24.1.0(003)
0-1:96.1.0(4530303235301234303567893232312345)
0-1:24.2.1(160304210000W)(00088.287*m3)
!EDB2
Let's break this datagram down, line by line.
/KFM5KAIFA-METER
This line tells you the type or model of the meter.
Obviously this will always remain the same for one particular Smart Meter.
You can simply ignore this line during the parsing of the datagram.
The line is followed by an empty line, which can also be ignored.
1-3:0.2.8(42)
This line shows you the software version of the Smart Meter, 4.2 in my case. The numbers in front of the software version are the line header. Your parser can use these numbers to find out what type of information is present on each line. In this case it is the software version type. This is true for all following lines, except for the last one.
0-0:1.0.0(160304215822W)
This line shows you the time stamp of this datagram. It was sent in 2016 on the 4th of March, at 21:58:22, Winter time (day light saving time).
0-0:96.1.1(4530303235301234303567893232312345)
This line is the serial number of the Smart Meter. Don't worry, it is not really my serial number, I have randomly changed quite some digits.
1-0:1.8.1(000072.833*kWh)
1-0:1.8.2(000062.071*kWh)
1-0:2.8.1(000000.000*kWh)
1-0:2.8.2(000000.000*kWh)
These 4 lines represent the counter for the consumed energy at tariff 1, the consumed energy at tariff 2, the returned energy at tariff 1 and the returned energy at tariff 2. I have to add the first two values together, because I do not have a dual tariff contract. The last two counters will remain 0 for me, as I do not have a solar panel installation (yet).
0-0:96.14.0(0001)
This indicates the current tariff.
It appears that tariff 1 is the night/weekend (low) tariff.
Tariff 2 is the day time (high) tariff.
If I had a dual tariff contract I could use this information to turn on heavy loads like a washing machine during the cheapest tariff.
1-0:1.7.0(01.069*kW)
This is the actual power consumption, which is updated every 10 seconds.
1-0:2.7.0(00.000*kW)
This is the actual power returned to the grid by solar panels. I don't have any, so this value will remain 0 for a while.
0-0:96.7.21(00008)
Here's the number of power failures in any phase. I only have one phase, and I didn't have any power failures yet. So obviously this is the value the meter came with. Or it has counted some glitches I haven't noticed.
0-0:96.7.9(00005)
Number of long power failures. Must be the number of failures during production and initial connection I presume.
1-0:99.97.0(1)(0-0:96.7.19)(000101000001W)(2147483647*s)
Power failure event log for long power failures. It's a time stamp and the duration in seconds. But obviously the clock wasn't set correctly yet, because it reads 2000, the 1st of January, way before this Smart Meter was built.
1-0:32.32.0(00000)
The number voltage sags.
1-0:32.36.0(00000)
The number of voltage swells.
0-0:96.13.1()
Text message codes. Can contain up to 8 digits. There's no message for me here now.
0-0:96.13.0()
Text message. Maximum of 1024 characters.
1-0:31.7.0(005*A)
This one is not mentioned in the documentation. It shows the actual current consumption from the grid. I have no idea what this value looks like if I was to feed current back to the grid. Will it be negative perhaps?
1-0:21.7.0(01.087*kW)
1-0:22.7.0(00.000*kW)
These two aren't in the documentation either. They appear to be a repetition of the currently consumed and returned power. I have no clue why they would repeat these values with different headers.
0-1:24.1.0(003)
This is the device type of the first connected extra meter. In my case it will be the gas meter.
0-1:96.1.0(4530303235301234303567893232312345)
A repetition of the serial number. Why? For the gas meter perhaps?
0-1:24.2.1(160304210000W)(00088.287*m3)
The last reading of the gas meter. The time stamp of the last reading says that this sample was taken in 2016 on the 4th of March, at 21:00:00 Winter time. The time stamp is followed by the actual gas counter.
!EDB2
This is a CRC16 value, calculated over the previous message from the starting / symbol up until the last ! symbol. If you like you can check the integrity of the message with this CRC value.
Obviously 3-phase meters will have more lines, but since I don't have a 3-phase meter I can't show you what such a datagram looks like.
What's Next?
Frankly, I don't know yet.
I will let you know on this site when I've decided what to do.
Eventually I want to automate everything, creating graphs of my energy consumption with unprecedented details.
Until then I simply run the minicom serial terminal program on Dave once a week to read the counters, which I then manually enter into my old spread sheet.
At least I don't have take my weekly pictures of the counters anymore now.
Updates
Someone pointed me to an official document explaining the P1 interface in full detail. Just in case you want to get the most out of the information provided by your smart meter.
I think that everybody loves to see graphs of their energy consumption.
You could tinker around yourself using influxdb and grafana for instance to make this happen.
You could also go for a ready made solution on www.volkszaehler.org, where they tell you how to setup a ready made, self hosted, graphing tool which could even run on a Raspberry Pi.
The only disadvantage might be that the website is in German.
Google translate may come to the rescue if you can't read German of course.
 Last week our energy supplier installed a new, so called, "Smart Meter" in our house.
In fact we've got two of those.
One of them is the gas meter, which reports its counter every hour to the new electricity meter.
Six times a year the counters are sent to the energy company, who will eventually send us their bill.
 Before the smart meters I used to take pictures of both electricity meter and gass meter every week.
Later I would enter the counters into a spread sheet to monitor our own energy consumption.
Surely this is going to be lot easier with the smart meter, right?
